

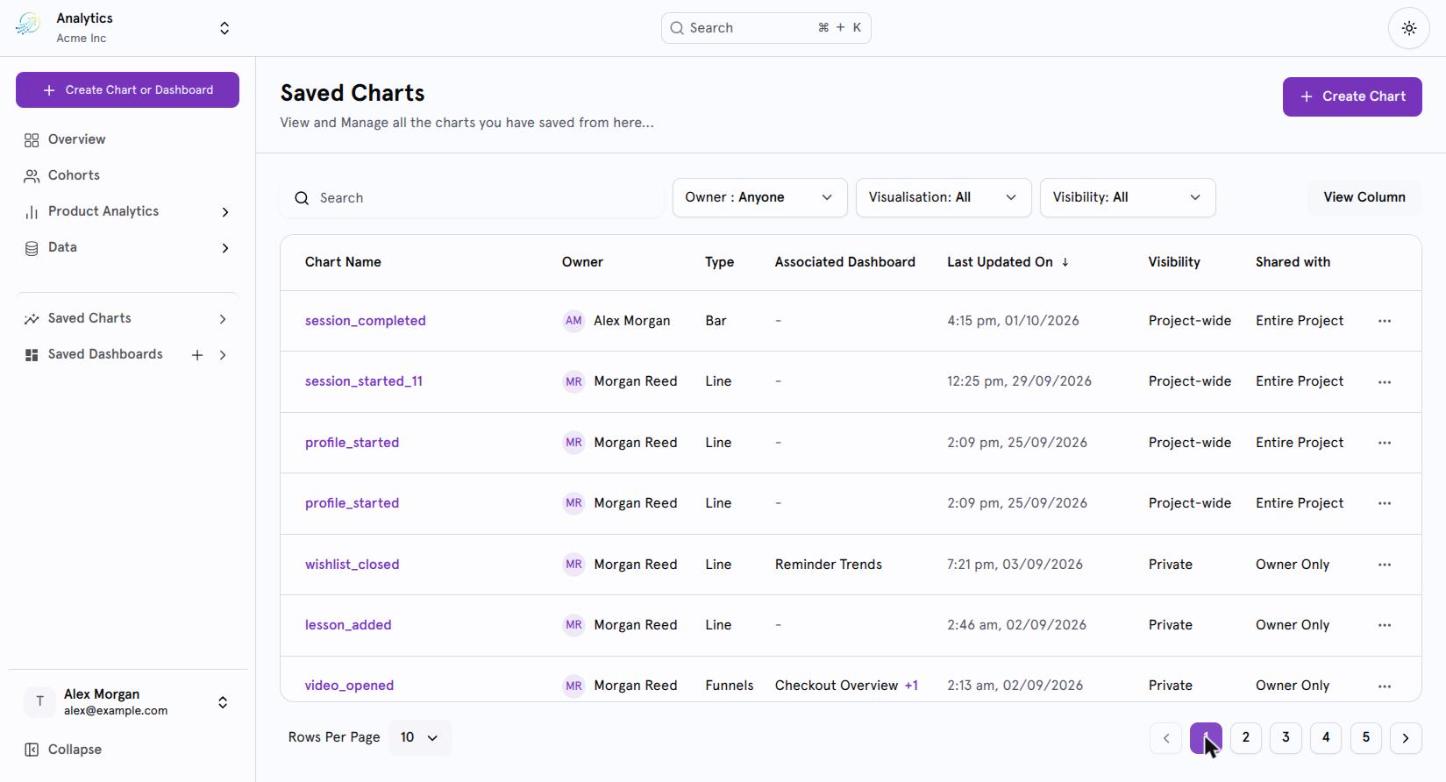
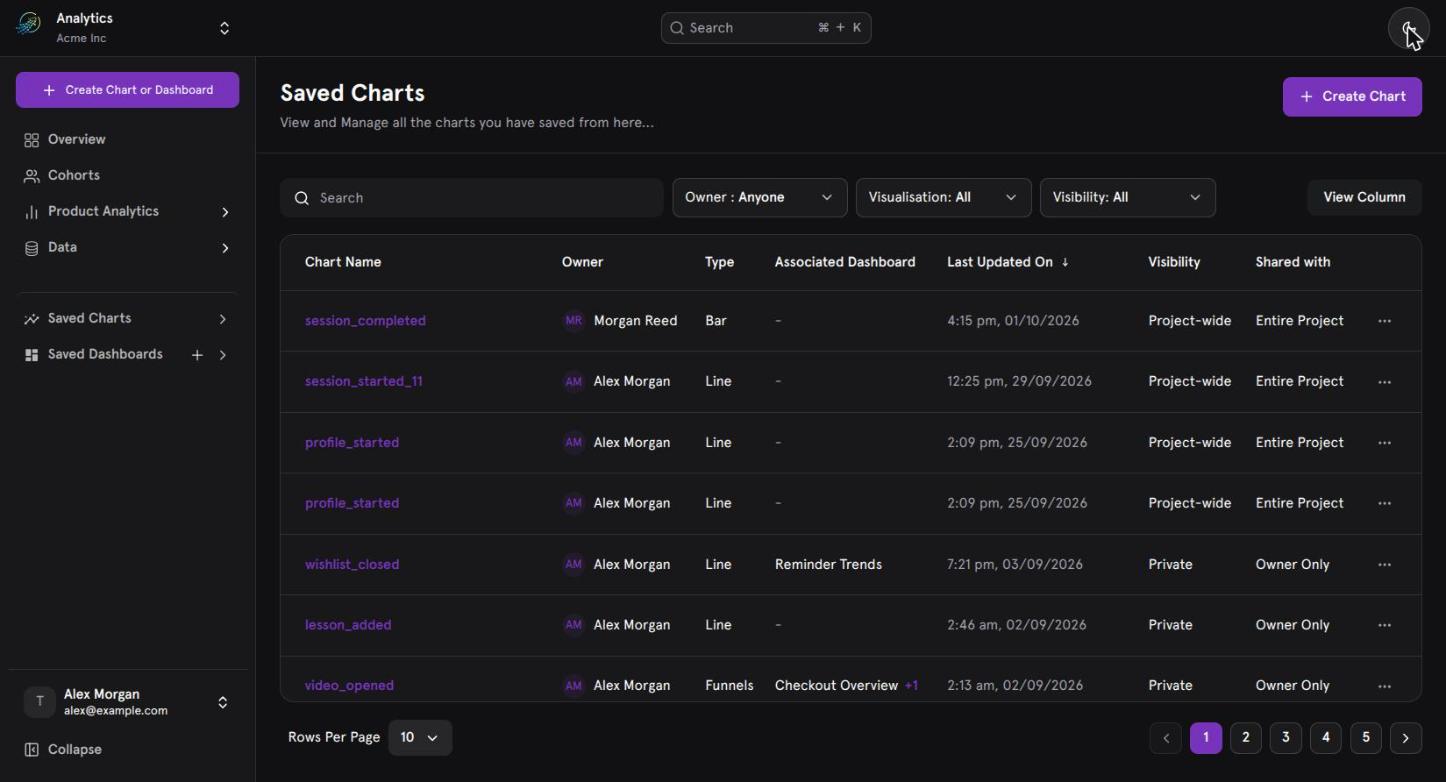
Saved Charts, listing every chart you can access in the project.
Where charts come from
Charts are created from the Create Chart or Dashboard action, which groups what you can build into three categories.Behavior Analytics
Funnels, Retention, Pivot Tables, User Sessions, Stickiness, Engagement Matrix, Impact Analysis.
Charts
Line, Stacked Line, Bar, Stacked Bar, Column, Stacked Column, Pie, Metric.
Default Templates
Flow Analysis, Feature Adoption, Product KPIs, User Activity.
Charts are independent of dashboards
This is the rule that explains most of the behavior in this section. Charts can be pinned to dashboards, but they do not belong to them. The two are separate resources with separate permissions, in both directions.Deleting a dashboard does not delete the charts it contained. They remain in Saved Charts until you delete them explicitly.
What the listing shows
The listing displays only the charts you are allowed to access, based on each chart’s visibility.Next steps
Manage charts
View, edit, share, duplicate, and delete.
Pin to a dashboard
Put a chart on Overview or a dashboard.
Permissions
How effective permission is resolved.
Saved Dashboards
Collections of pinned charts.